


.png)

Turning raw data into genuine business value might sound like a complicated puzzle for many leaders and analysts today. Yet, simply collecting more data does not automatically lead to better decisions, with over 70 percent of business data never actually analysed or used. Most companies end up overwhelmed by numbers that never become useful insights. The true advantage comes when you focus on meaningful metrics, apply structure, and let insights guide your actions in ways your competitors never see coming.
Table of Contents
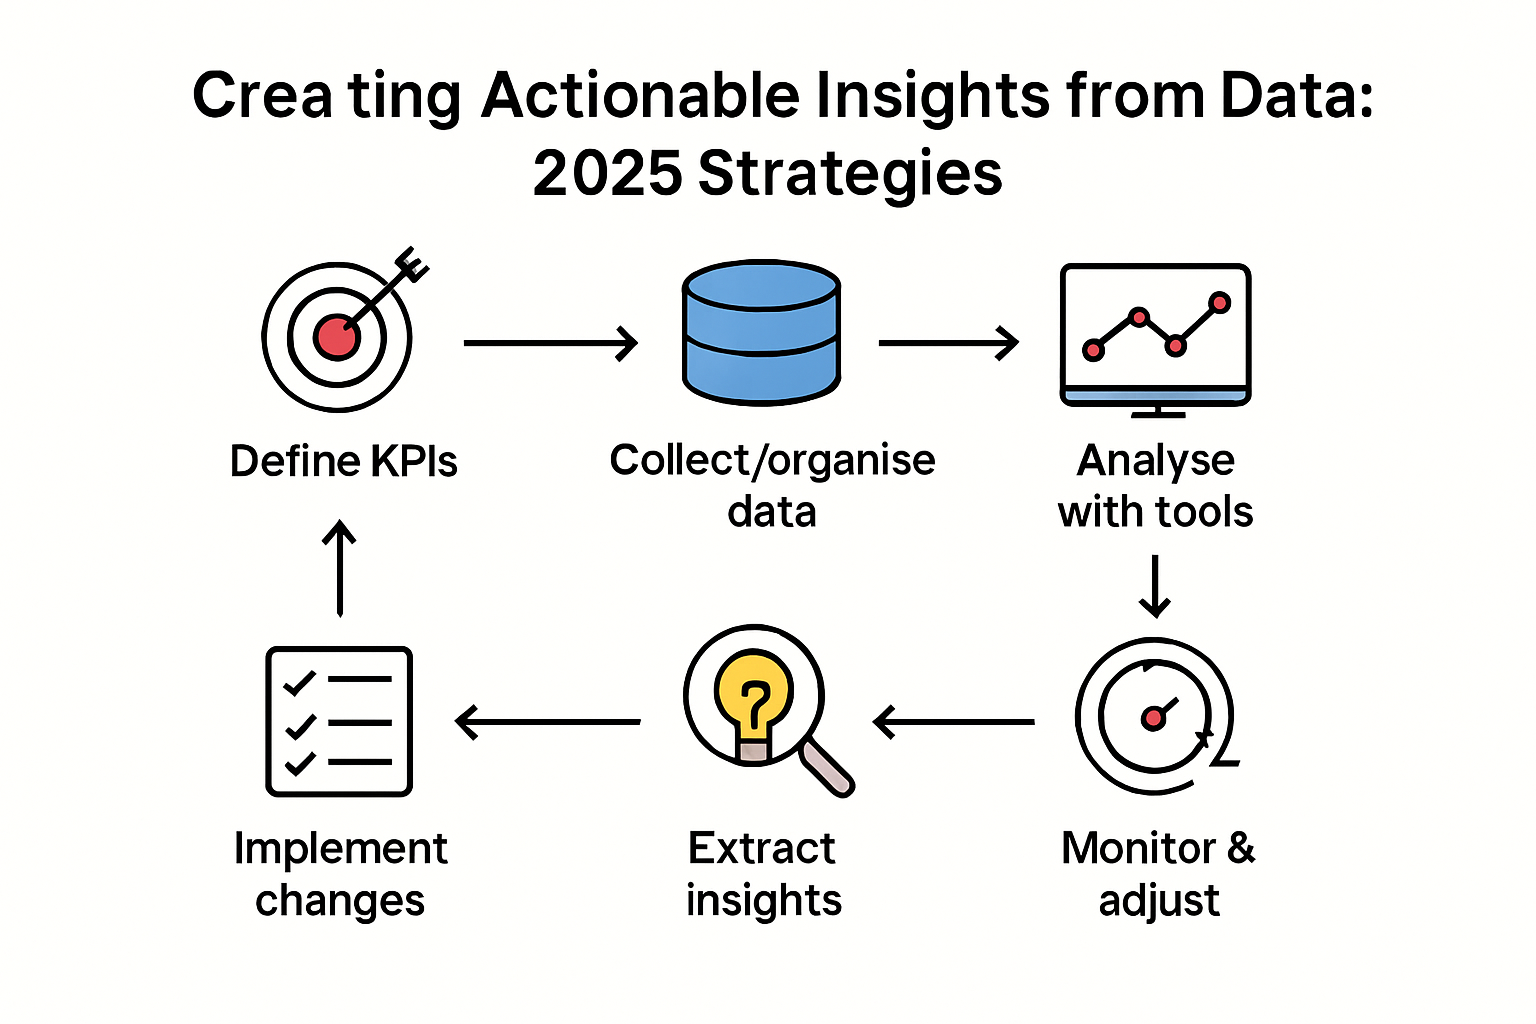
- Step 1: Define Your Key Performance Indicators
- Step 2: Collect and Organise Your Data
- Step 3: Analyse Data Using Relevant Tools
- Step 4: Interpret Findings to Extract Insights
- Step 5: Implement Changes Based on Insights
- Step 6: Monitor Outcomes and Adjust Strategies
To help you get started, here is an overview table outlining each key step in the data-to-insight process, including the main action involved and key outcomes. This summary makes it easier to plan your approach and track your progress.
| Step | Main Action | Key Outcome |
|---|---|---|
| 1. Define KPIs | Map business goals and select strategic KPIs | Clear, actionable metrics linked to objectives |
| 2. Collect & Organise Data | Identify sources, standardise, and structure data | Reliable, accessible and secure data |
| 3. Analyse Data | Apply analytical tools aligned with KPIs | Identification of trends and relationships |
| 4. Interpret Findings | Contextualise findings for business relevance | Actionable insights and recommendations |
| 5. Implement Changes | Prioritise, plan, and roll out initiatives | Tangible business improvements |
| 6. Monitor & Adjust | Track KPIs and refine strategies | Continuous improvement and agility |
Quick Summary
| Key Point | Explanation |
|---|---|
| 1. Define Strategic KPIs | Align Key Performance Indicators with specific business goals to ensure they drive meaningful insights. |
| 2. Systematic Data Collection | Establish a robust data collection process to ensure consistency and reliability in your data resources. |
| 3. Apply Effective Analysis Tools | Use suitable analytical tools tailored to your KPIs for deeper data insights and trends. |
| 4. Extract Meaningful Insights | Contextualise findings within business objectives to derive actionable and strategic recommendations. |
| 5. Monitor and Adjust Strategies | Regularly track outcomes and refine your strategies based on performance metrics to stay agile and effective. |
Step 1: Define Your Key Performance Indicators
Creating actionable insights from data begins with establishing clear, strategic performance indicators that transform raw information into meaningful business intelligence. Defining your Key Performance Indicators (KPIs) is not merely a technical exercise but a critical strategic process that connects your data collection efforts directly to organisational objectives.
Start by mapping your specific business goals with precision. What outcomes matter most? Whether you are tracking sales conversions, customer engagement, or operational efficiency, each KPI must directly reflect a core strategic priority. learn more about performance tracking to ensure your metrics truly represent meaningful progress.
The selection process requires thoughtful consideration. Effective KPIs are quantifiable, directly aligned with strategic objectives, and provide actionable insights. Rather than collecting data indiscriminately, focus on indicators that offer genuine potential for strategic decision making. For instance, instead of tracking total website visitors, concentrate on metrics like conversion rate, average session duration, or customer acquisition cost that reveal deeper performance insights.
Consider developing a hierarchical KPI framework that connects strategic, tactical, and operational levels. At the strategic level, focus on high-level indicators that reflect overall business health. Tactical KPIs should break down these broad objectives into departmental or team-specific measurements. Operational KPIs then provide granular, real-time insights into day-to-day performance.
According to Harvard Kennedy School’s Government Performance Lab, successful KPI development involves an iterative approach. This means regularly reviewing and refining your indicators to ensure they remain relevant and continue driving meaningful organisational improvements. Implement a quarterly review process where you assess the effectiveness of your current KPIs and make necessary adjustments based on evolving business strategies and market conditions.
Step 2: Collect and Organise Your Data
After defining your Key Performance Indicators, the critical next phase in creating actionable insights from data involves systematic collection and organisation of your information resources. This step transforms raw data into a structured, accessible format that enables meaningful analysis and strategic decision making.
Data collection requires a strategic and disciplined approach. Begin by identifying all potential data sources relevant to your established KPIs. These might include customer relationship management systems, web analytics platforms, sales databases, social media insights, and direct customer feedback channels. discover advanced analytics techniques to understand comprehensive data integration strategies.
Implement a robust data collection protocol that ensures consistency and reliability. Standardise data entry processes across all platforms, creating uniform templates and guidelines that minimise human error. Automated data collection tools can significantly reduce manual input risks and provide real-time information gathering. Consider using cloud-based platforms that offer seamless integration across multiple data sources, enabling centralised storage and immediate accessibility.
According to the University of Illinois Research Data Service, effective data organisation involves meticulous file naming conventions, version control, and selecting appropriate storage formats. Develop a clear, logical folder structure that categorises data by type, date, source, and relevance. Use consistent naming protocols that allow immediate identification of files, such as “CustomerEngagement_Q2_2025_Final.xlsx” instead of generic titles like “data.xlsx”.
Establish data governance protocols that address privacy, security, and compliance requirements. Implement encryption methods, access controls, and regular backup systems to protect your valuable information assets. Create a data inventory that tracks the origin, collection method, and last update for each dataset, ensuring transparency and facilitating future audits. By treating data as a strategic asset and implementing rigorous collection and organisation practices, you set the foundation for generating truly actionable insights that drive organisational performance.
Step 3: Analyse Data Using Relevant Tools
Data analysis transforms collected information into strategic insights, bridging the gap between raw numbers and meaningful business intelligence. After carefully collecting and organising your data, the next crucial step involves deploying appropriate analytical tools that unlock deeper understanding and reveal actionable patterns.
Modern data analysis requires a multifaceted technological approach. Select analytical tools that align specifically with your established Key Performance Indicators and organisational goals. explore comprehensive tracking strategies to enhance your analytical capabilities. Statistical software packages like R, Python, and specialised platforms such as Tableau provide robust capabilities for transforming complex datasets into comprehensible visualisations and meaningful insights.
Begin by applying descriptive analytics to understand what has already occurred within your datasets. Examine historical trends, identify statistical distributions, and create visual representations that highlight critical patterns. Regression analysis, correlation studies, and segmentation techniques can help uncover relationships between different variables that might not be immediately apparent.
For a successful data analysis stage, using the right set of tools is essential. The following table summarises the primary tools and platforms mentioned in the article, along with their purposes and example uses, making your technology selection easier.
| Tool/Platform | Purpose | Example Use |
|---|---|---|
| R | Statistical analysis and modelling | Conduct regression and correlation studies |
| Python | Data processing and analysis | Clean and analyse large datasets |
| Tableau | Data visualisation | Create interactive dashboards |
| CRM Systems | Capture and store customer data | Analyse sales and engagement trends |
| Cloud platforms | Centralised storage & integration | Access data across departments |
| Automated data collection tools | Real-time and accurate data gathering | Reduce manual errors and speed up collection |
According to the Federal Data Strategy’s Action Plan, developing a comprehensive data analysis strategy involves more than technical proficiency. Cultivate a data-driven organisational culture that encourages critical thinking and interpretative skills. Train team members to move beyond surface-level observations, teaching them to ask probing questions and challenge existing assumptions.
Implement a systematic approach to data interpretation. Start by cross-referencing findings against your original KPIs, ensuring that your analysis remains focused and relevant. Look for unexpected correlations, emerging trends, and potential anomalies that could indicate significant operational insights. Develop a standardised reporting framework that translates complex analytical findings into clear, actionable recommendations for stakeholders across different organisational levels.
Step 4: Interpret Findings to Extract Insights
Interpreting data findings represents the critical moment where raw information transforms into strategic intelligence. This stage moves beyond mere statistical analysis, requiring a nuanced approach that connects numerical patterns to real-world business implications and potential actionable strategies.
Effective insight extraction demands a structured yet creative analytical mindset. Begin by contextualising your data findings against the original Key Performance Indicators established in earlier stages. uncover advanced user data interpretation techniques to enhance your analytical capabilities. Look beyond surface-level statistics to understand the underlying narratives and potential causative relationships within your datasets.
Develop a systematic framework for translating complex data points into meaningful business recommendations. This involves identifying significant trends, unexpected correlations, and potential performance barriers. Examine your findings through multiple perspectives, considering both quantitative metrics and qualitative contextual factors. For instance, a drop in conversion rates might not simply represent a numerical decline but could signal deeper issues with user experience, marketing strategy, or product positioning.
According to the Institute of Education Sciences, successful data interpretation requires a comprehensive approach that goes beyond technical analysis. Engage cross-functional teams in collaborative interpretation sessions, bringing diverse perspectives to understand the multifaceted implications of your findings. Create visual storytelling techniques that translate complex data into intuitive narratives, making insights accessible to stakeholders across different organisational levels.
Verify the quality of your insights by conducting a rigorous validation process. Cross-reference findings with external benchmarks, historical data, and industry standards. Develop a confidence scoring system that helps distinguish between statistically significant insights and potentially misleading correlations. By maintaining a disciplined yet flexible approach to data interpretation, you transform raw information into a powerful strategic asset that drives informed decision-making.
Step 5: Implement Changes Based on Insights
Transforming data insights into concrete organisational change represents the most critical phase of your strategic data journey. This step bridges analytical understanding with practical implementation, converting theoretical knowledge into tangible business improvements that drive performance and competitive advantage.
Successful implementation requires a structured, methodical approach to organisational transformation. explore cutting-edge analytics implementation strategies to refine your change management process. Begin by prioritising insights based on their potential impact, strategic alignment, and feasibility. Not all findings warrant immediate action, so develop a weighted scoring system that helps you distinguish between incremental improvements and transformative opportunities.
Craft a comprehensive implementation roadmap that breaks down complex insights into manageable, actionable initiatives. This involves creating detailed project plans with clear milestones, responsible team members, resource allocations, and expected outcomes. Establish a phased rollout strategy that allows for iterative testing and continuous refinement. Consider piloting changes in controlled environments before full-scale deployment, enabling your organisation to validate assumptions and mitigate potential risks.
According to the Educause Data and Analytics Maturity Model, successful implementation demands robust stakeholder engagement and transparent communication. Develop a communication strategy that explains the rationale behind proposed changes, highlighting how data-driven insights directly contribute to organisational objectives. Engage leadership and cross-functional teams in collaborative discussions, fostering a culture of data-driven decision making and collective ownership.
Establish robust monitoring mechanisms to track the effectiveness of implemented changes. Create comparative baselines using your original Key Performance Indicators, enabling precise measurement of improvement. Schedule regular review sessions to assess progress, identify unexpected challenges, and make necessary adjustments. By maintaining a flexible, iterative approach to implementation, you transform data insights from static information into a dynamic catalyst for continuous organisational evolution.

Step 6: Monitor Outcomes and Adjust Strategies
Monitoring outcomes represents the critical feedback loop that transforms data-driven strategies from static plans into dynamic, responsive organisational approaches. This final step ensures continuous improvement by systematically tracking the impact of implemented changes and proactively adjusting strategies based on real-world performance metrics.
Effective outcome monitoring requires a comprehensive and disciplined approach to performance tracking. explore advanced campaign performance techniques to enhance your monitoring capabilities. Establish a robust dashboard that integrates key performance indicators with real-time data visualization, enabling immediate insights into strategic effectiveness. Develop a set of leading and lagging indicators that provide a holistic view of organisational performance, capturing both immediate results and long-term trends.
Create a structured review process that goes beyond surface-level metrics. Schedule regular strategy assessment meetings where cross-functional teams critically examine performance data, challenge existing assumptions, and collaboratively develop adaptive strategies. Implement a quantitative scoring system that objectively evaluates the success of implemented changes, allowing for nuanced understanding of incremental improvements and potential areas requiring further intervention.
According to the Brookings Institution, successful outcome monitoring hinges on leveraging digital tools that enable rapid data collection and analysis. Invest in advanced analytics platforms that offer predictive modelling capabilities, allowing your organisation to anticipate potential challenges and proactively develop mitigation strategies. Embrace a culture of continuous learning, where data becomes a catalyst for ongoing improvement rather than a retrospective reporting mechanism.
Establish clear thresholds for strategic recalibration. Develop a decision-making framework that specifies when and how to pivot strategies based on performance metrics. This might involve setting specific trigger points that initiate comprehensive strategic reviews, ensuring your organisation remains agile and responsive to changing market dynamics. By maintaining a disciplined yet flexible approach to outcome monitoring, you transform data insights into a powerful mechanism for sustained organisational growth and innovation.
Turn Your Data Strategies Into Real Business Growth With AdPage
You have invested time in understanding the importance of KPIs, robust data collection and truly actionable insights. However, as highlighted in the article, many businesses still struggle with unreliable data, inaccurate tracking and the frustration of lost conversions due to outdated analytics methods. The stakes are high when even a single missed conversion can impact your strategic decisions and overall growth. The difference between knowing what is happening and knowing why it happens comes from collecting 100% accurate data and acting on it with confidence.
Experience the relief of having every user action tracked and every conversion accounted for. AdPage empowers marketing agencies and online retailers by providing advanced server-side tagging and consent management tools that integrate effortlessly with platforms like Shopify and WooCommerce. Ensure full data compliance and eliminate uncertainty. See how seamless onboarding and comprehensive reporting help you drive better business results right away.
Ready to finally trust your data and unleash the full value of your analytics? Visit AdPage and start optimising your tracking systems today. Act now to prevent data loss and turn your new 2025 strategies into measurable outcomes.
Frequently Asked Questions
What are Key Performance Indicators (KPIs) and why are they important?
Key Performance Indicators (KPIs) are measurable values that demonstrate how effectively an organisation is achieving key business objectives. They are essential as they provide a clear focus for strategic decision-making and help assess performance over time.
How can I effectively collect and organise data for analysis?
To effectively collect and organise data, identify relevant data sources, standardise data entry processes, and implement automated tools for real-time information gathering. Use logical folder structures and naming conventions to maintain data integrity and accessibility.
What tools can I use for data analysis?
For data analysis, consider using statistical software like R and Python, as well as data visualisation platforms like Tableau. These tools help in transforming complex datasets into comprehensible insights and visualisations that aid in decision-making.
How should I implement changes based on data insights?
Implement changes by prioritising insights based on their impact and feasibility, developing a comprehensive roadmap, and engaging stakeholders in the communication of proposed changes. Monitor the effectiveness of these changes using established KPIs to ensure continuous improvement.