


.png)

Google Analytics 4 (GA4) Reports
Tracking campaign performance and analyzing various statistics is an essential part of online marketing. So where online marketers have been used to working with Google Universal Analytics (UA) for years, the announcement of the release of a new analytics platform from Google was a bit of a switch.
As of July 1, 2023, Google Universal Analytics is history and the data of your website traffic is stored in Google Analytics 4 (GA4). The transition from Google Universal Analytics to Google Analytics 4 can take some getting used to. With the help of this article, we will explain to you how you can view the desired data in Google Analytics 4 to increase your online success.
Reports in GA4
The reports that were visible by default within Google UA no longer exist. The statistics you were used to looking at over the past few years are gone. Now you will have to set up the desired reports yourself to view the desired data in, for example, a dashboard or report overview.
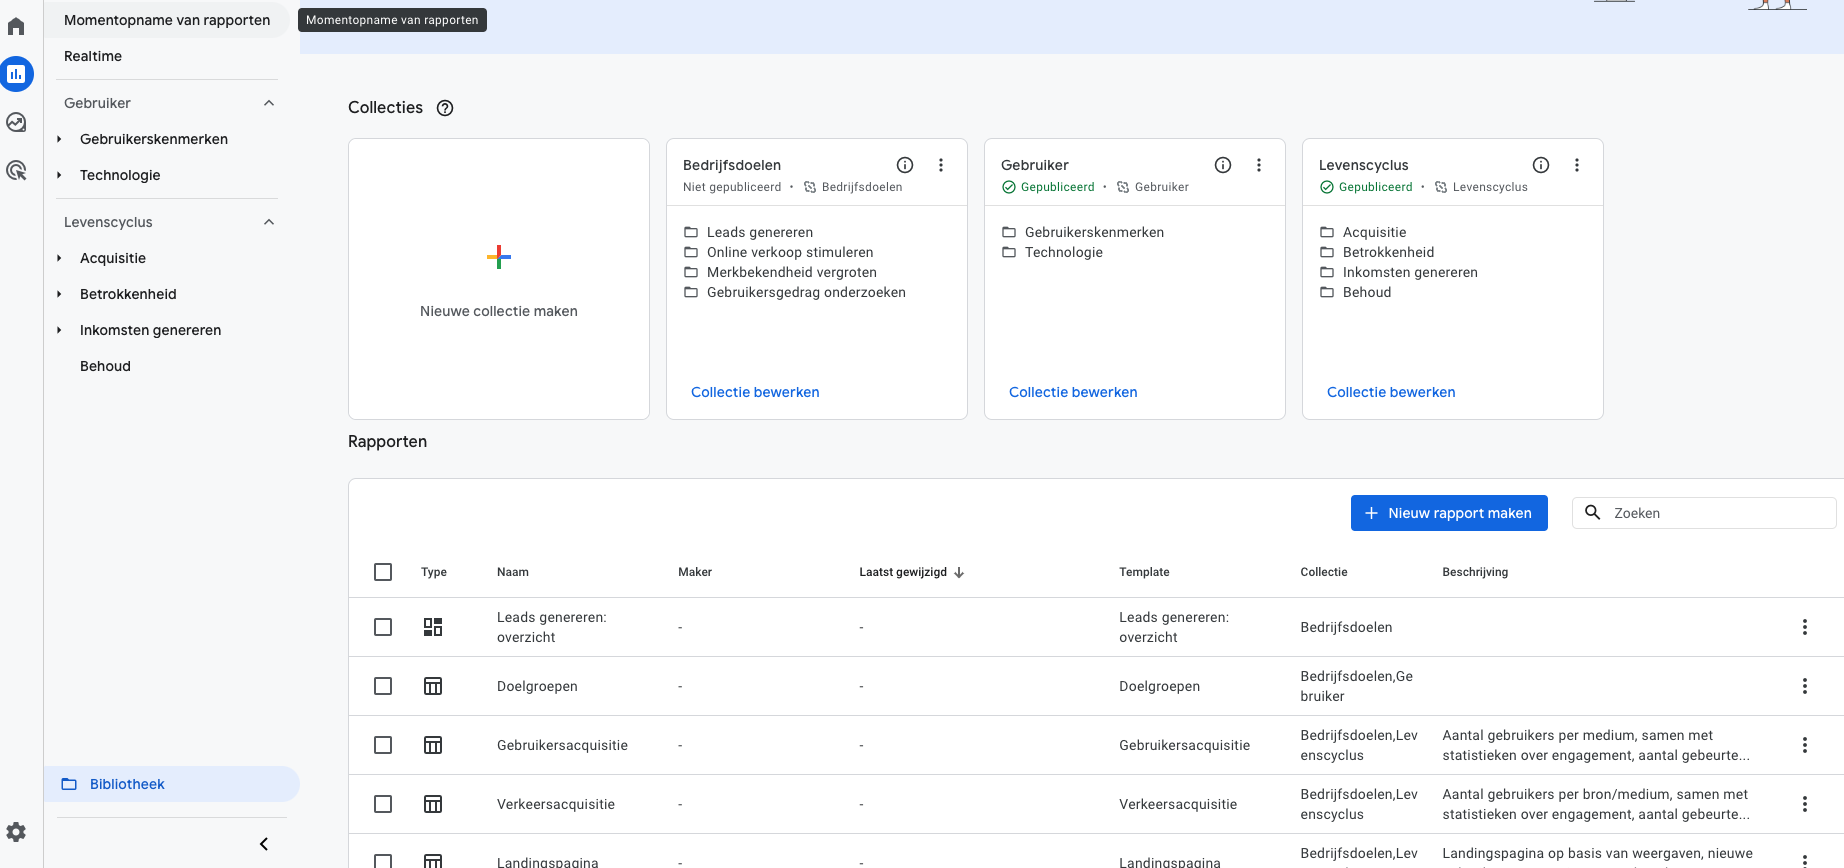
In the library within 'Reports' in GA4 there already are several templates for using reports for you, also called 'collections'. We will explain different collections to you.
Should you be unable to see the library under 'Reports,' it is because you do not have the proper permissions within that Google Analytics property.
Standard Reports
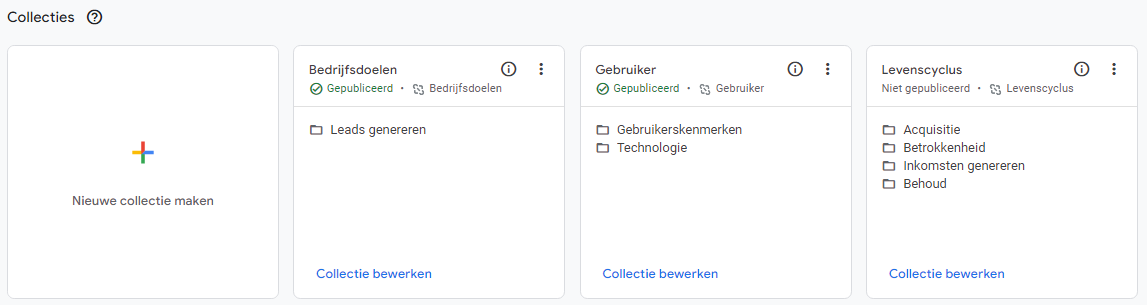
There are three collections that are already created by default within every GA4 account. By default, these collections contain reports with the data most frequently invoked within Google Analytics. These are the following collections:
- Life Cycle
- Business Goals
- User
Life Cycle
Curious about how people actually experience your website or app? The lifecycle collection gives you valuable insights into users' usage behavior, from initial contact to their continued engagement. The lifecycle collection includes acquisition, engagement, revenue generation and retention reports.
Acquisition
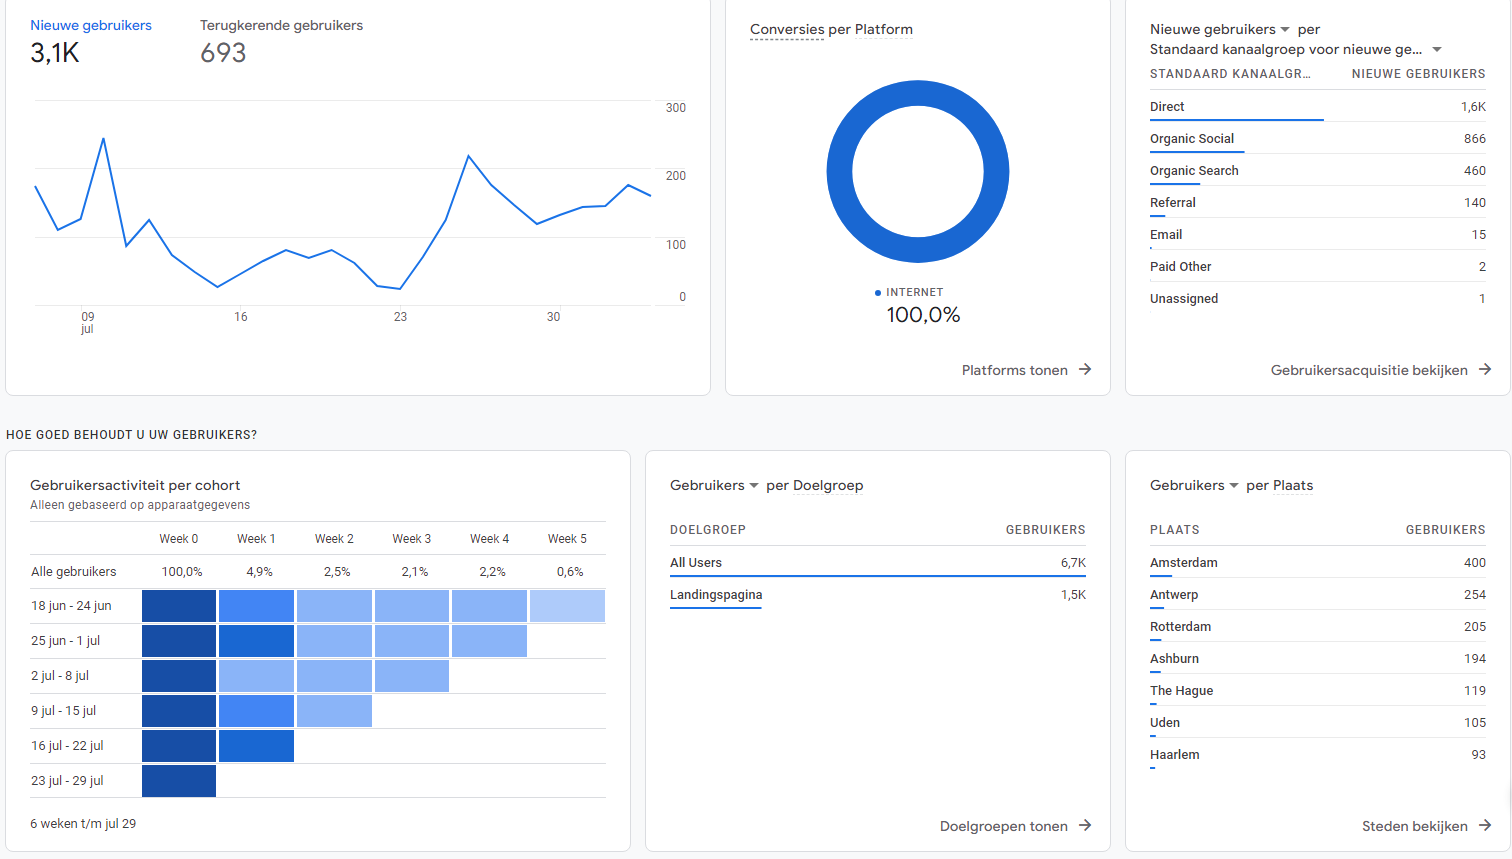
One of the most common usage scenarios of Google Analytics is to see where visitors are coming from. GA4 can show this data, but some parts of the interface can be confusing compared to Universal Analytics. Acquisition data is in the standard lifecycle collection report.
The main thing you can see in acquisition is where visitors come from, whether through organic search or seo, through Google Ads or directly. Within the acquisition reports, in addition to seeing where visitors come from, you can also see what regions your visitors come from, what channels or campaigns they came to your site through, and the ratio of new to returning users.
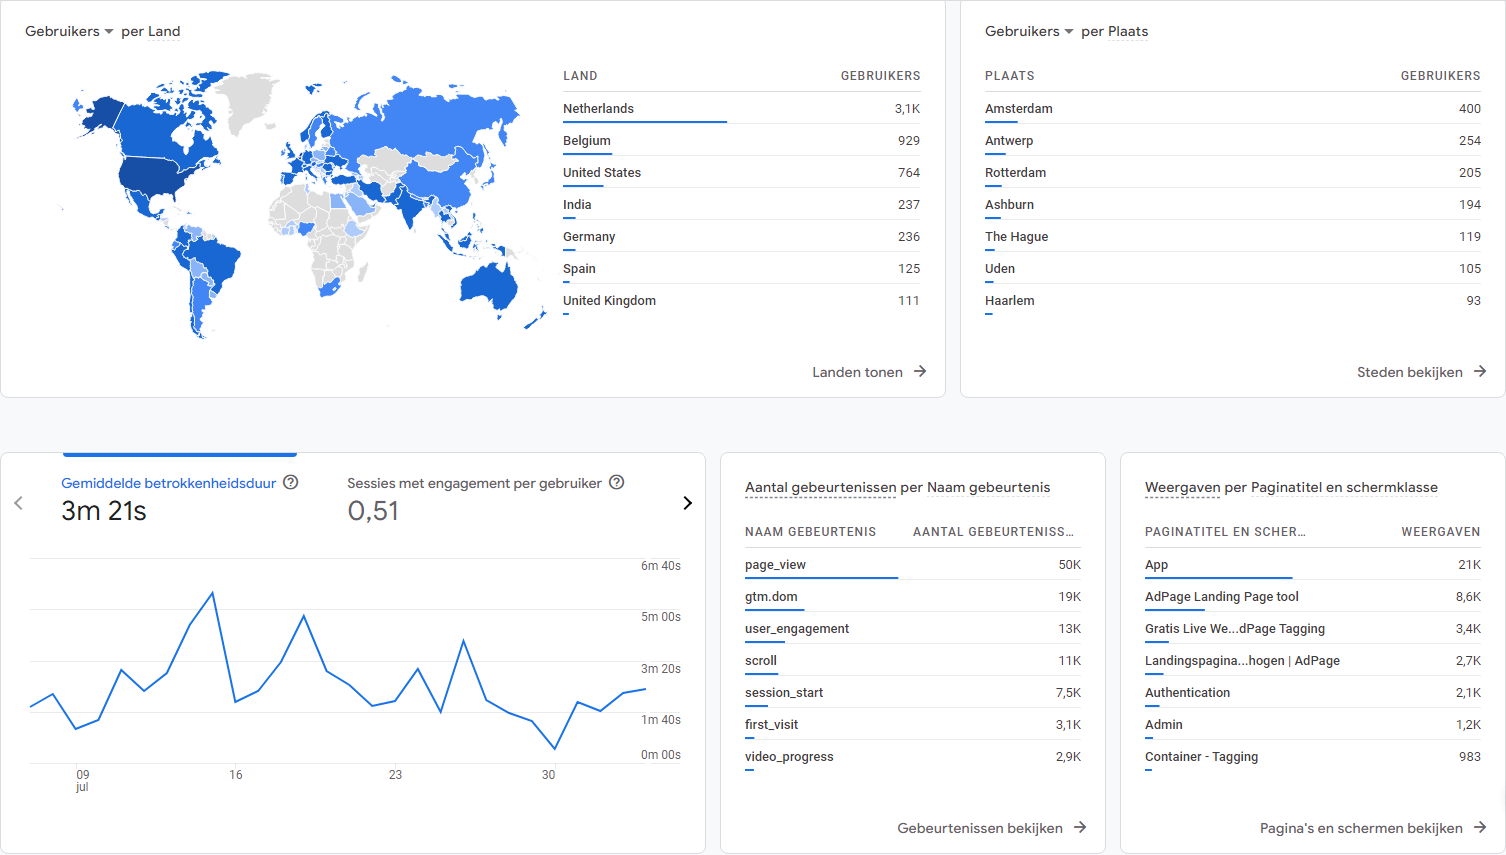
Involvement
In addition to being able to see where visitors are coming from in the acquisition reports, you can also view the engagement of your users. Engagement refers to the event interactions with your site. Among other things, user engagement, engagement duration, user loyalty and scrolls are important components of engagement.
Every event a visitor performs on your site is stored within GA4. Suppose a visitor comes to your site for the first time, scrolls a bit, clicks a link to go to the next page and leaves your site again. Then the following events are measured and shown in the event report within the engagement collection:
The user ..., and the measured event is ....
visits the homepage > first_visit, page_view & session_start
scrolls a bit > scroll
goes to next page > user_engagement
arrives on the second page > page_view
leave the website > user_engagement
Above is an example of how this could work in practice. However, you will have to set up events from within your website via Google Tag Manager. Default events can be found here.
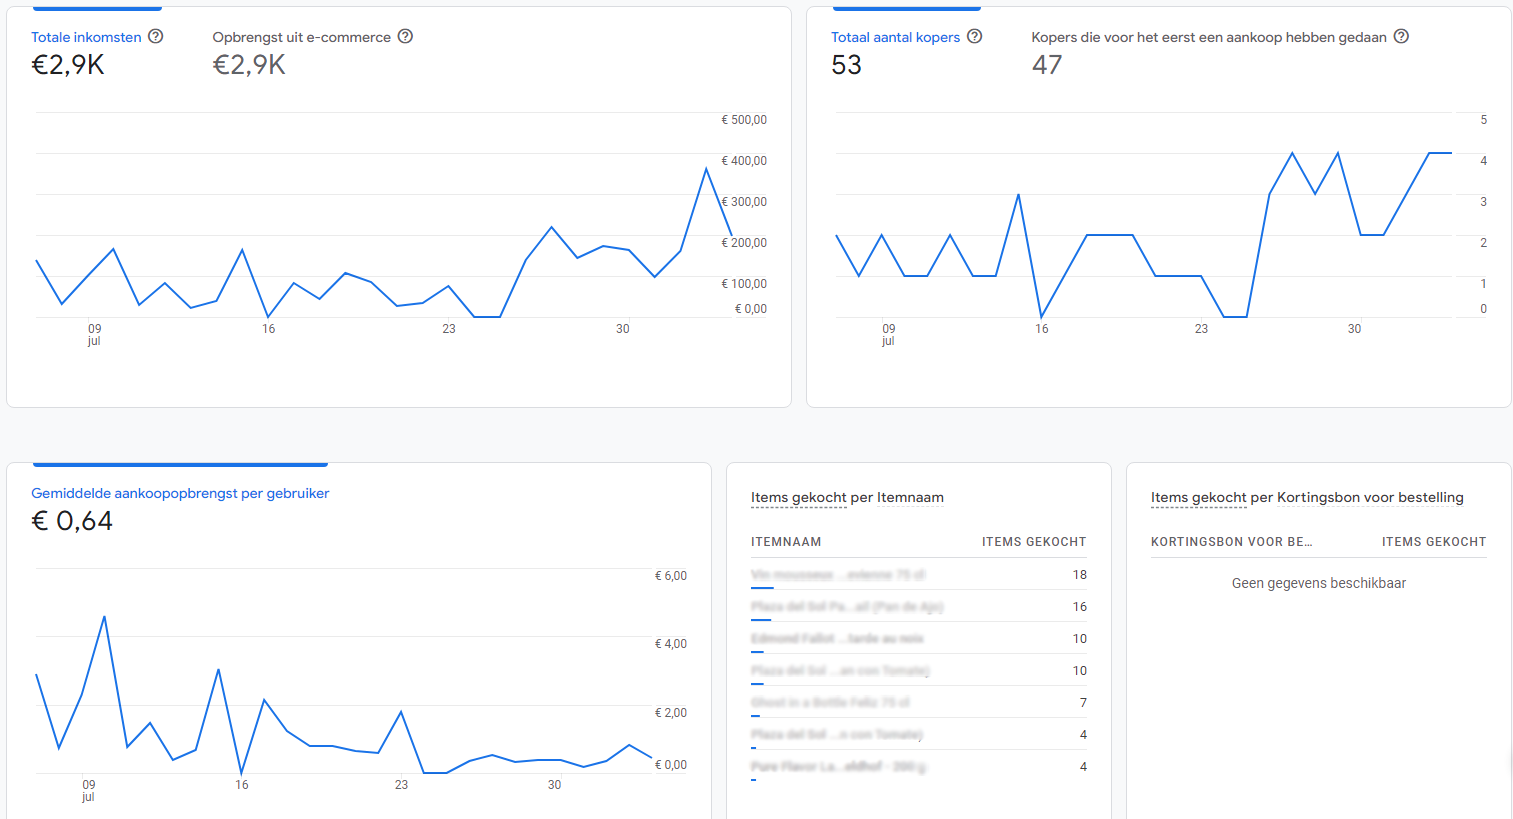
Revenue generation
In addition to your user acquisition and engagement, you can also view e-commerce revenue data within the lifecycle collection. Here you can view your e-commerce, subscription and advertising revenues in one view. You can also track revenue over time to identify user trends and track the success of campaigns. This is a useful report to keep an eye on your conversion rate as an online store.
Preserve
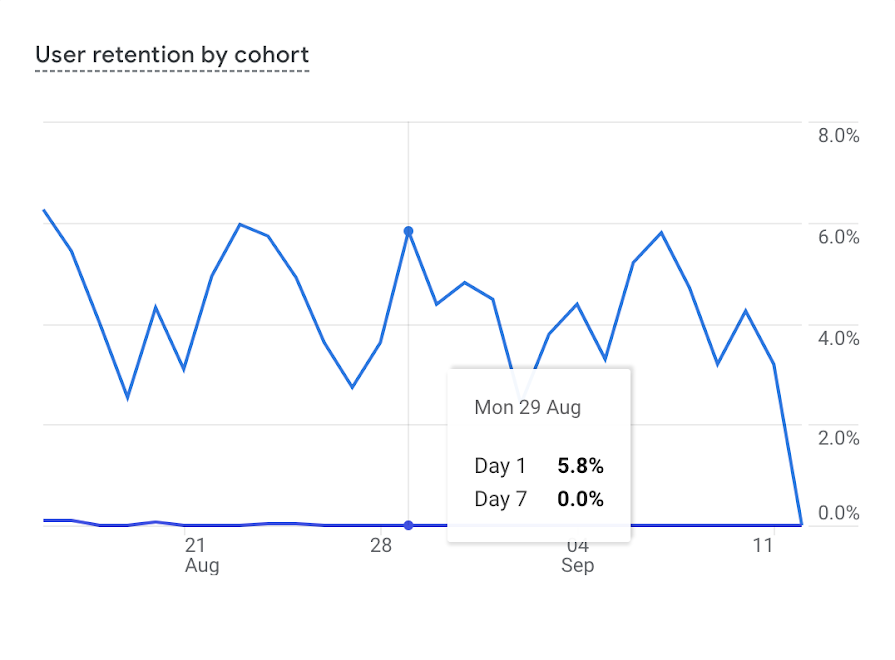
The retention report consists of individual cards that summarize retention data for all users. In this report, you can see the difference between new and returning users, user loyalty, user engagement and lifetime value, among other things.
In addition, you can also view user loyalty and user engagement by cohort. Unlike the general data on user loyalty and user engagement, here it is measured per cohort (per period since the first session). It measures how much loyalty and engagement remains from users 7 and 30 days later.
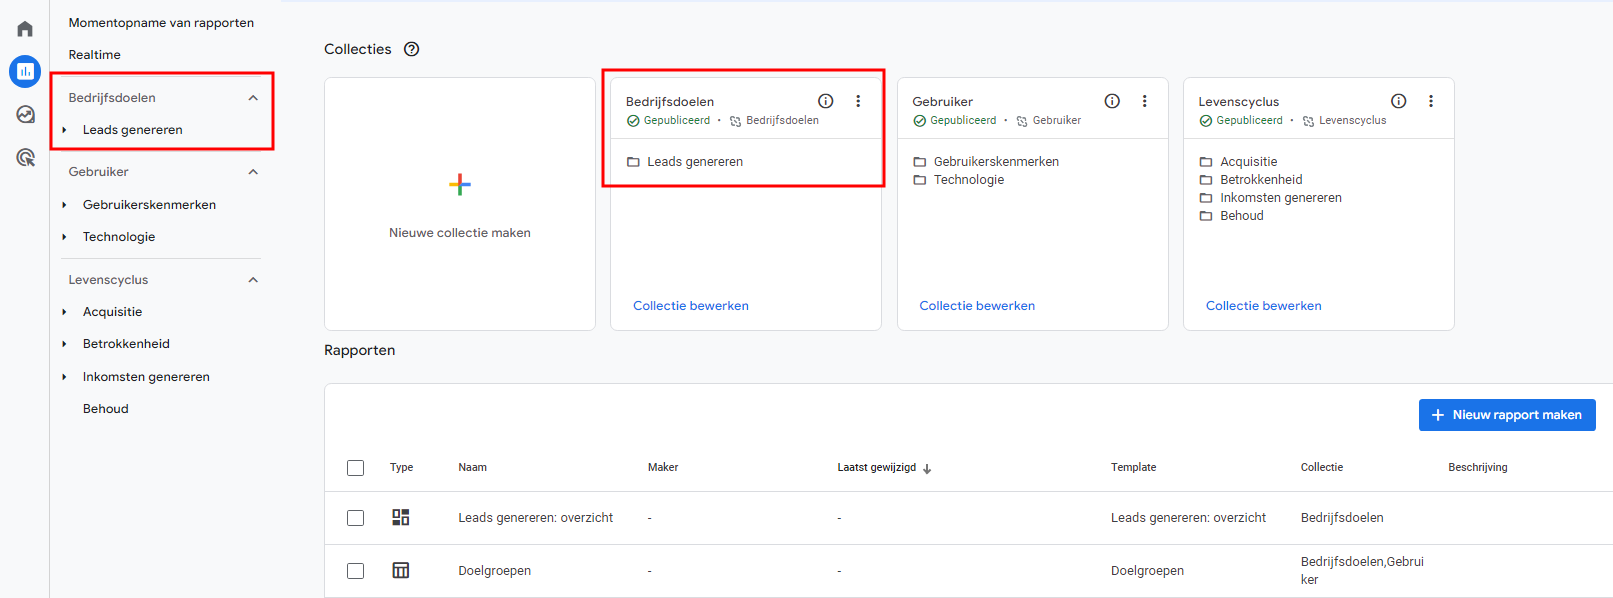
Business Goals
With the business goals collection, you get to see a personalized set of reports based on the information you gave about your organization during the initial configuration of Google Analytics. During the first launch of Google Analytics since the switch from Universal Analytics to GA4, you were asked some questions about your organization and what purpose you want to use GA4 for. Once you completed these questions, GA4 collected a number of standard reports for you based on this information.
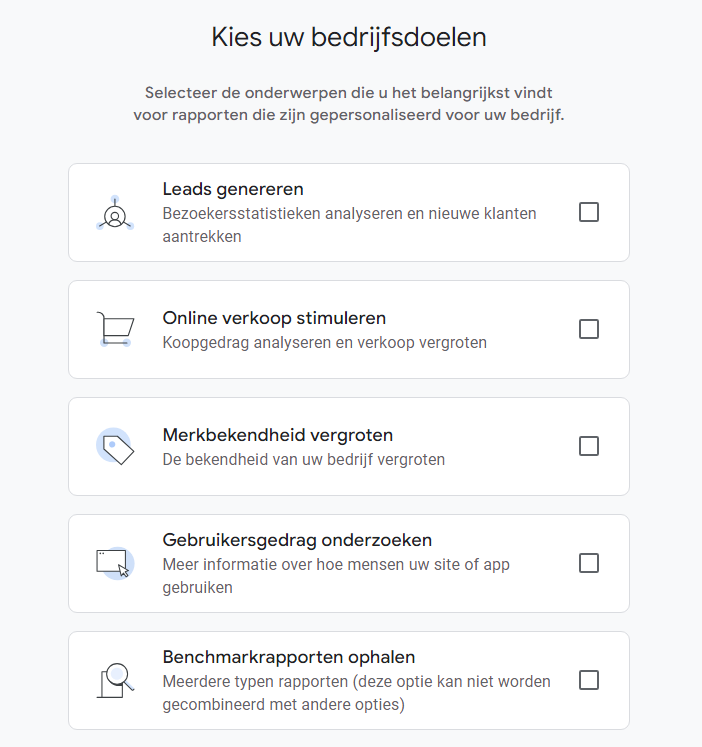
The possible reports you may see after completing a goal:
- Lead generation
- Boosting online sales
- Increase brand awareness
- Examining user behavior
- Benchmark reports
For each of these goals, a number of standard reports are displayed that should help you achieve them.
Lead generation
For this purpose, you will see all reports related to user acquisition, traffic acquisition, target groups and landing pages. These reports will help give you insights into visitor statistics so that you can more easily attract new customers and leads.
Boosting online sales
For this purpose, you will see standard reports related to e-commerce purchases and promotions. These reports will help give you insights into the buying behavior of your customers so that you can increase the number of conversions and therefore the revenue of your organization.
Increase brand awareness
For this purpose, you will see standard reports related to Google Ads campaigns, demographics and pages visited. These reports will help give you insights into the types of visitors and which messaging/pages are successful allowing you to analyze how to further design your business communications.
Examining user behavior
For this purpose you will see standard reports related to site events, conversions and page views. These reports will help give you insights into how visitors are using your site that will allow you to optimize your site.

Benchmark reports
If you choose benchmark reports, you will see standard reports from the life cycle collection. The lifecycle collection is the complete collection of all standard reports that can be used within the business goals collection. So if you do not enter a goal, Google Analytics cannot determine which reports are important to you within the business goals collection.
Don't remember which goal you once selected? Within GA4 you can see this by looking in the left column to see what report can be found under "Business Goals," or by looking to see what report can be found under the business goals collection within your library.
So with benchmark reports, you have the freedom to decide which reports you do and do not want to see. Want to know how to create your own reports from the library? Further on in this blog article under 'Extended Reports' this is explained.
User
User collection allows you to get a clear picture of the people who use your Web site. Among other things, you can see their demographics, such as age and location, and the technology they use, such as the version of their browser or app. The user collection includes two components: user characteristics and technology.
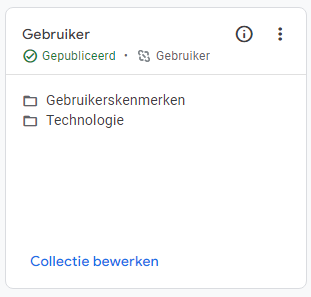
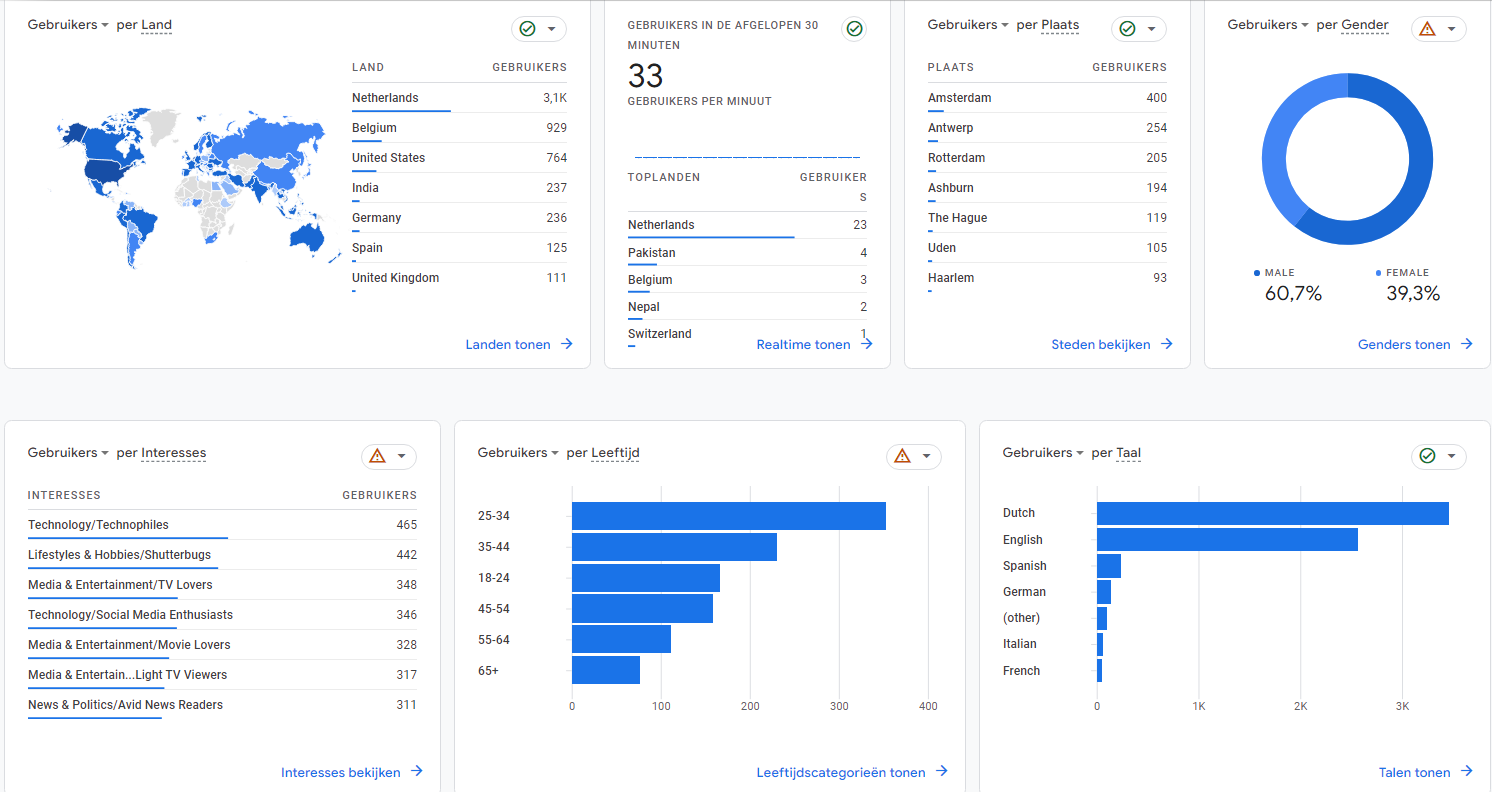
User Features
User characteristics reports include demographics and target groups. Using these reports, you can determine which audiences are the most engaged and profitable and from which countries/regions the most profitable and engaged visitors come.
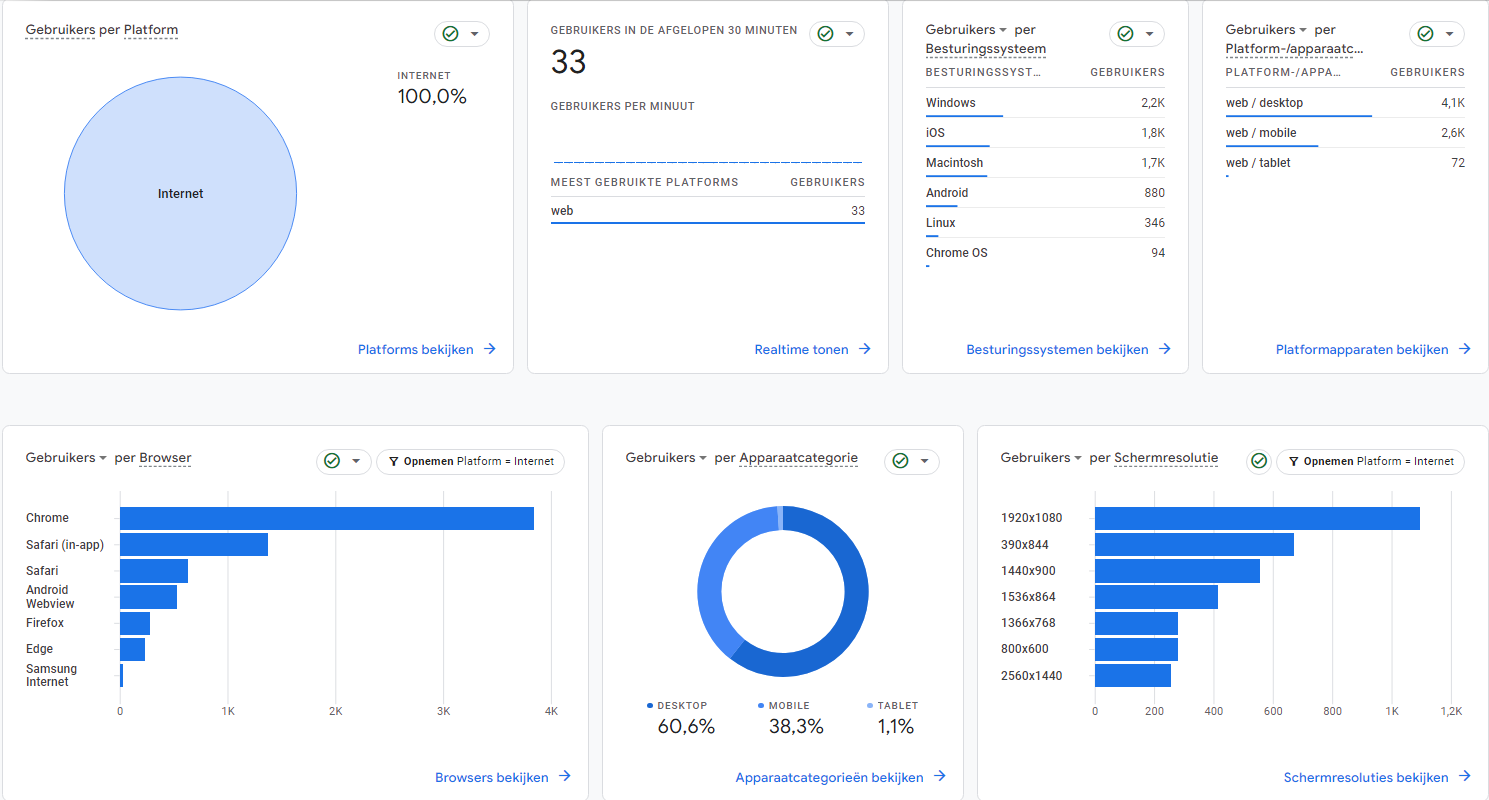
Technology
Technology reports consist of an overview and the technical data. These components help you identify the technology people use to access your website such as browser type, their screen resolution, app version and operating system type.
Comprehensive reports
The standard reports may not be sufficient for your situation. In that case, go to library and check what other reports are available. In your library you can create new reports and new collections.
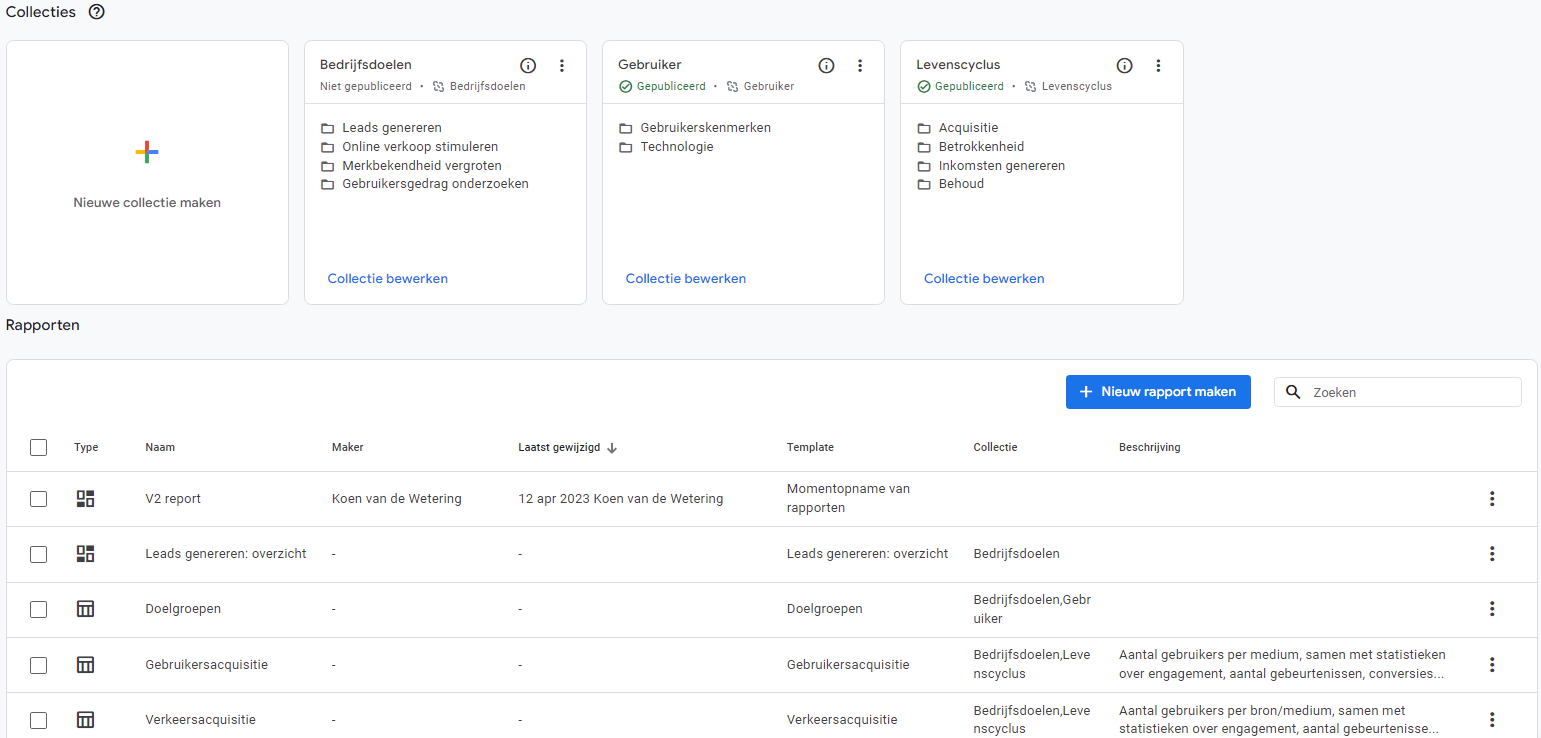
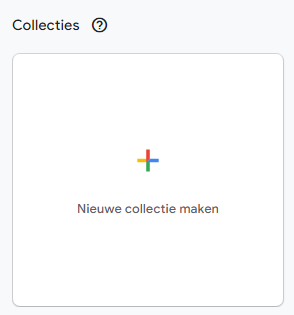
Create new collection
You create a collection when there are multiple reports within GA4 that you want to have easily present in an overview in the left column. In your library, you can click the large button with the colorful plus icon to create a new collection.
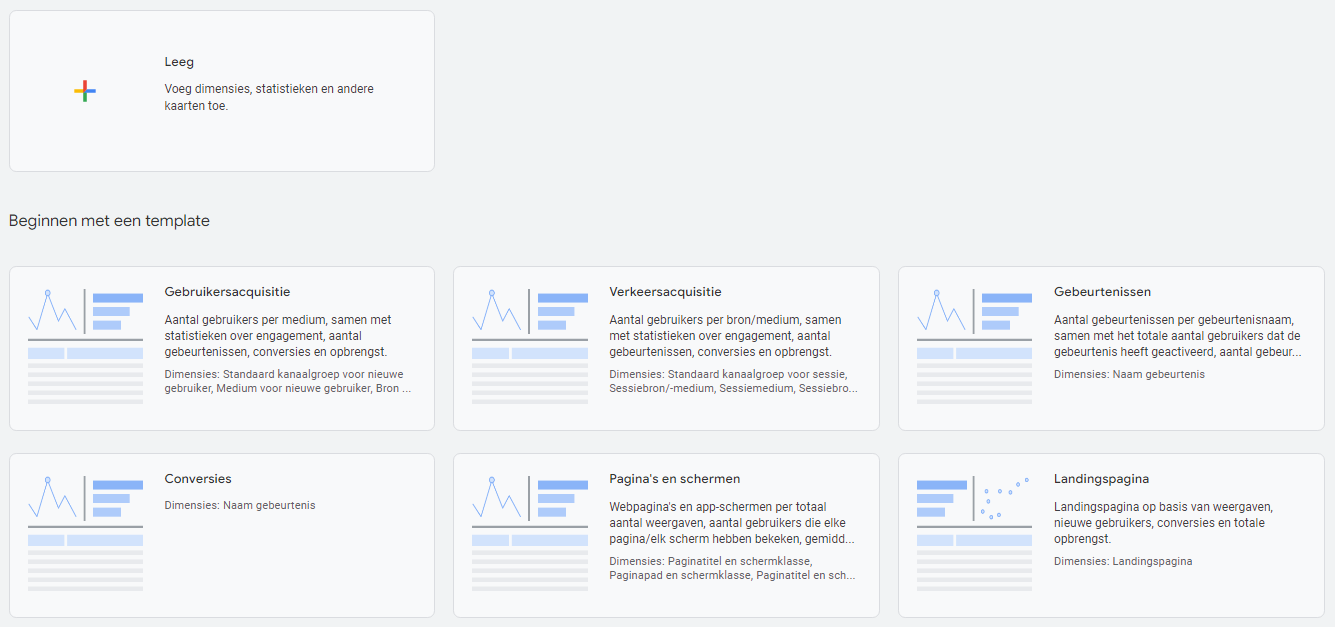
You can then choose an empty collection that you add to yourself or you can choose a template.
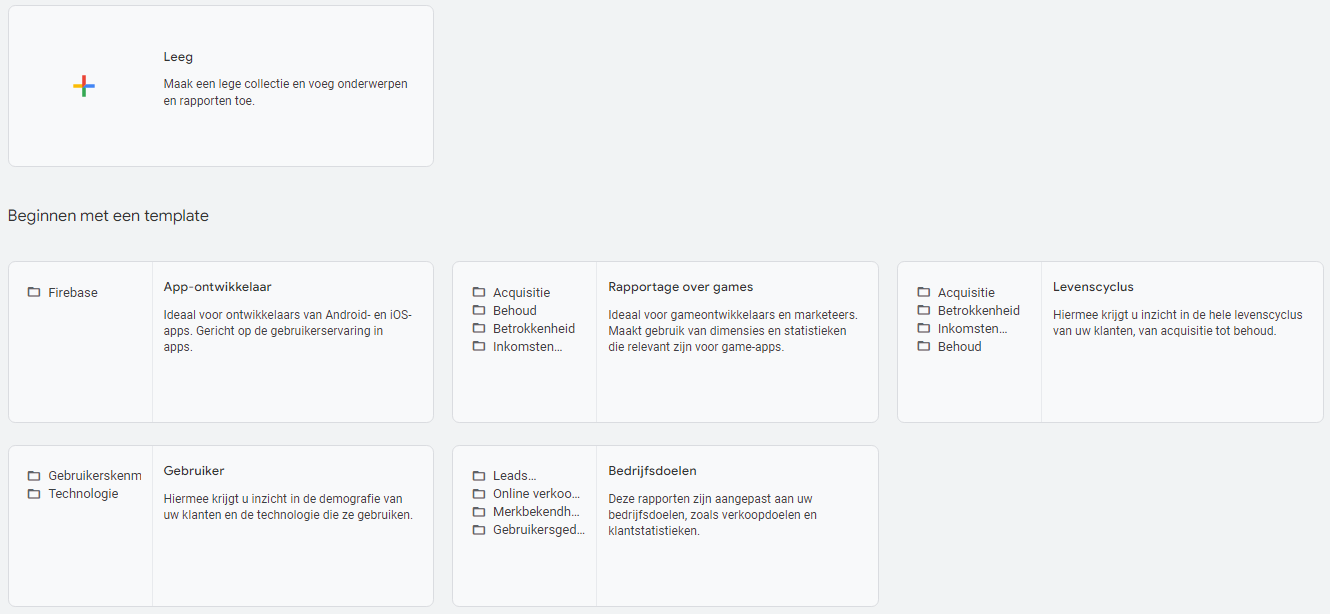
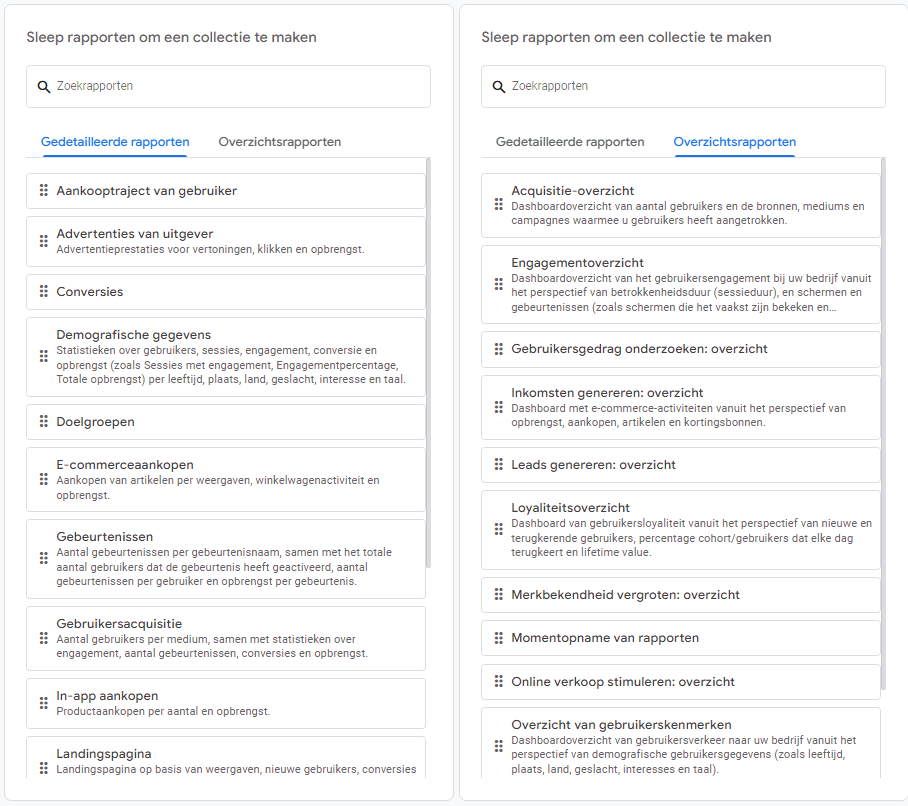
When you choose a template or an empty collection, you come to a screen where you can choose possible reports to add to this collection. These are both detailed reports and overview reports that you can drag into the collection to create your own overview.
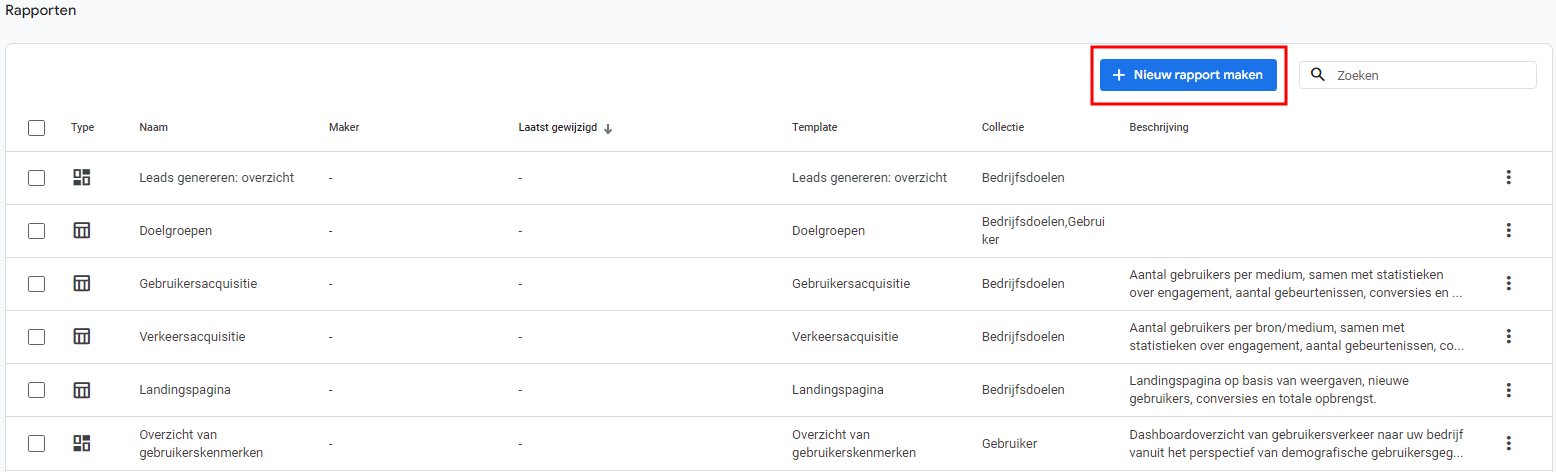
Create new report
In addition to being able to create a collection of existing reports, you can also create completely new reports. You create these by clicking on the big blue button within your library.
You are then given the choice of creating an overview report or a details report. An overview report is a collection of reports in the form of a dashboard. For report details, think of a completely new chart/table that you set up yourself based on dimensions, statistics and other charts.

Overview Report
When you want to create a summary report, you will see an empty dashboard. Here you can add your own charts. All existing charts and tables from the standard reports can be found here so that you can create an overview report/dashboard for yourself with only the most important reports.
Report details
If you want to create a new report, you can choose between a blank report or a template.
When you choose a template, you can add your own dimensions and values to an existing report and change all the settings to your liking based on the already filled in settings GA4 has added for the template. If you choose an empty report then you have to add all the dimensions, values, filters, charts and maps yourself based on your requirements.
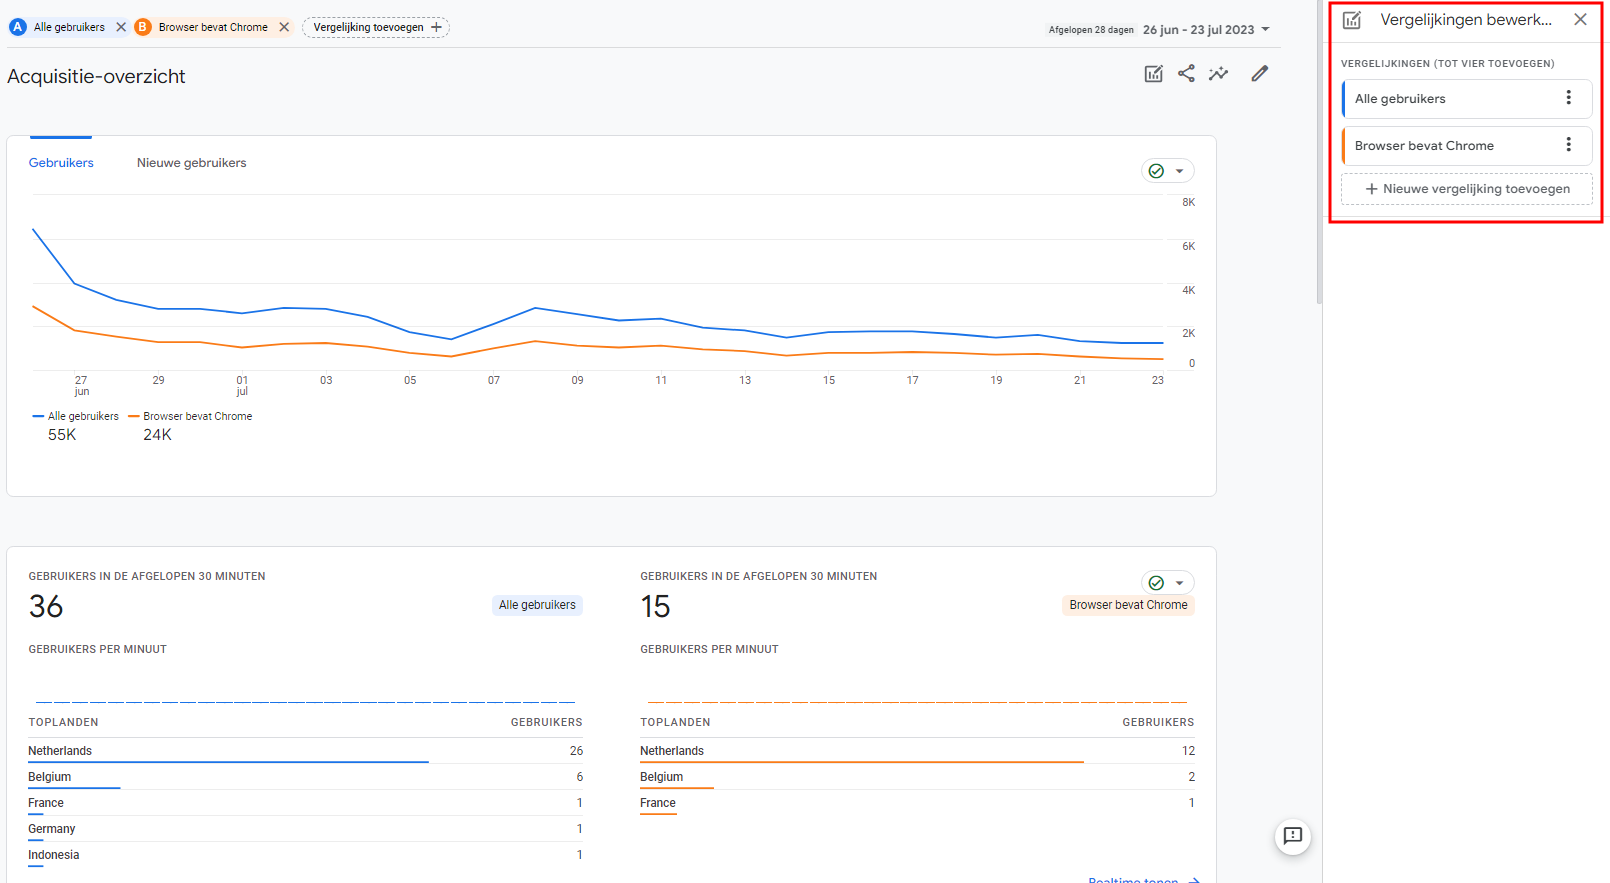
Compare reports
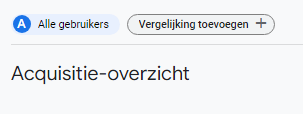
In addition to creating your own reports or collections to get certain data in one view, you can also compare reports with each other. Among other things, to see which segments your different visitors belong to, you can compare this data in your acquisition view. At the top of the acquisition overview you can add comparisons with dimensions you have entered yourself
In addition, you can also use the pencil icon at the top right to focus the overview of all acquisitions on the most relevant dates for your situation.
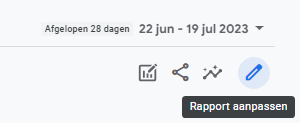
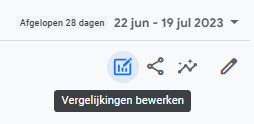
But the most prominent way is by clicking on the graph icon. Here you can add comparisons based on the report you currently have in front of you.
For example, when you are in the acquisition view, you can add a comparison against "All users. You do this by adding conditions based on self-created or default dimensions.


You can filter by different dimensions. Filtering can be done based on demographics, geography, lifetime value of a user, platform/device used, time, traffic source and on self-created dimensions.
When you filter on dimensions, you can choose between standard dimensions from GA4 or custom definitions. A custom definition is created when you want to measure an interaction on your website that is not measured as an event within GA4. Custom dimensions are created by going to 'Management' and then to 'Custom definitions'.
You create a new dimension by giving it a name, choosing between Event, User or Item as the range, and choosing an event parameter, user property or item parameter.
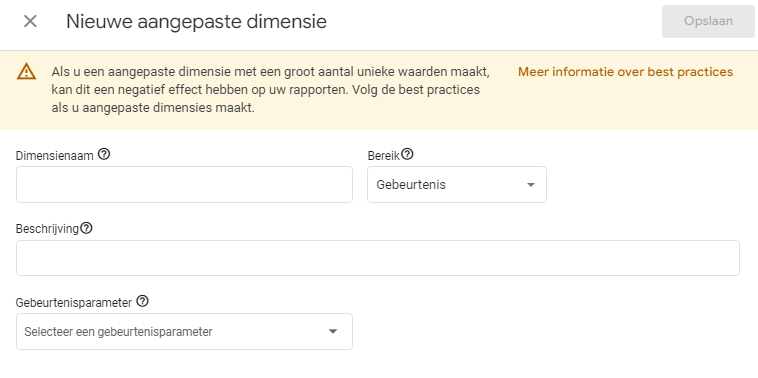
The application of self-created dimensions is determined by the range. The range determines what data the dimension is applied to. For example, if you want to compare based on a self-created event within GA4, then choose "Event" as the scope.
The values of these dimensions are provided by defined event parameters, user properties and item parameters. Choose a parameter or property from the list to use as a custom dimension.
Be careful when creating custom dimensions, though! If you create a custom dimension with a large number of unique values, it can have a negative effect on your reports. Always check first whether the dimension you want to create already exists as a default property or parameter.
Fill reports
Now that you have a clear idea of the insights GA4 reports can offer you, it is important that you collect data to populate these reports. The success of your analyses will depend on the accuracy and completeness of the data you collect. In today's world where storing visitor data and cookies is made increasingly difficult by browsers, operating systems and the constantly changing AVG legislation, collecting the right data in GA4 is becoming increasingly difficult. This is where we at AdPage have responded with server-side tagging.
By using server-side tagging, you ensure that you can continue to measure all your visitor data in a legitimate way, without the interference of browsers, operating systems and adblockers. This will result in reliable and comprehensive GA4 reports. Don't hesitate any longer, take the next step to data-driven success by choosing AdPage server-side tagging and thereby maximize the value of your GA4 implementation.
Learn more about server-side tagging. Or schedule a demo.